Psychology Research Methods Mind Map
University · Psychology · Updated 31 October 2026
This psychology research methods mind map puts the essentials on one page: the main research designs, variables and hypotheses, experimental designs, sampling, reliability and validity, ethics, and how to choose the right statistical test. Every branch is explained in the notes below the map.
It is pitched at first-year psychology degrees, and covers the core that A level psychology shares. Psychology and statistics are among the subjects where mapping has been studied in higher education, and research methods suits a map well because each choice, from design to data to test, links to the next.
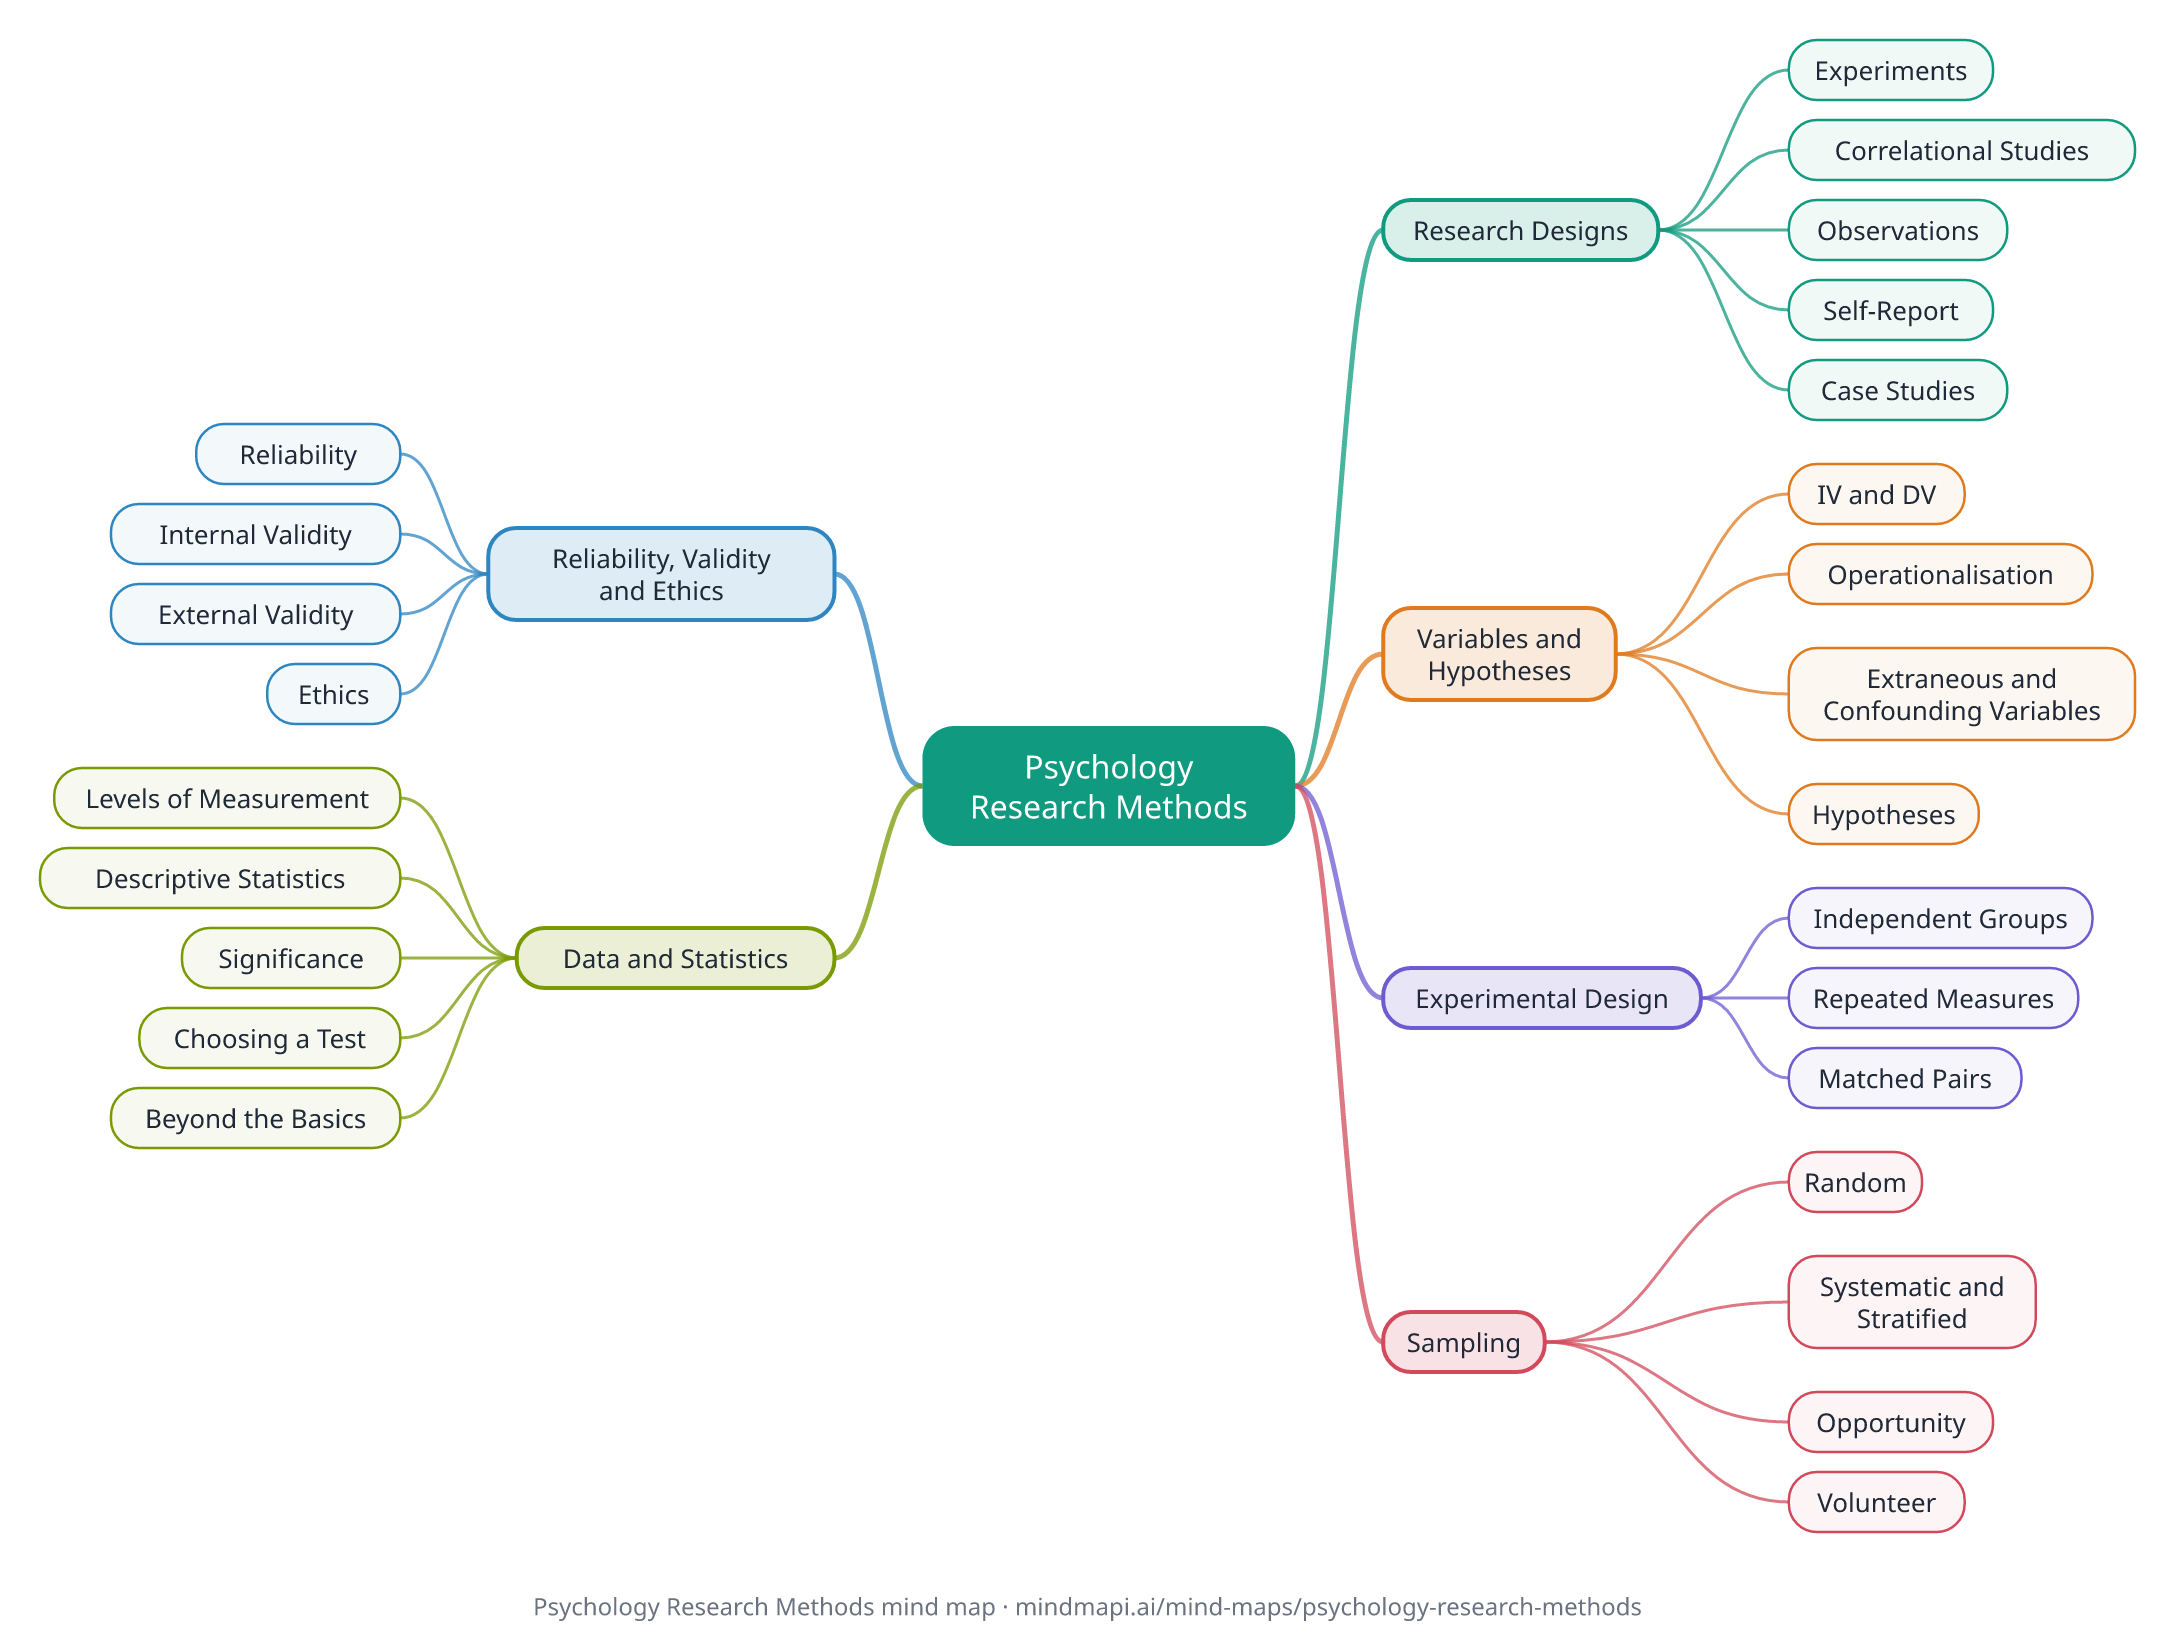
Download this mind map
Print the map with all the notes as a PDF revision sheet, or save the map as an image. Free to use for revision and in class.
Psychology Research Methods mind map explained
Research Designs
The main ways psychologists collect data.
Experiments
The researcher manipulates an independent variable and measures its effect. Laboratory, field, natural and quasi-experiments differ in how much control the researcher has.
Correlational Studies
Measure the relationship between two variables without manipulating either. A correlation does not show cause and effect.
Observations
Naturalistic or controlled, covert or overt, participant or non-participant. Behaviour categories and time or event sampling make them more systematic.
Self-Report
Questionnaires and interviews, from structured to unstructured. They reach thoughts and feelings, but answers can be affected by social desirability bias.
Case Studies
In-depth studies of one person or a small group. Rich detail, but hard to generalise.
Variables and Hypotheses
Defining exactly what is being tested.
IV and DV
The independent variable is changed by the researcher; the dependent variable is measured.
Operationalisation
Defining variables so they can be measured, for example memory as the number of words recalled out of twenty.
Extraneous and Confounding Variables
Extraneous variables could affect the dependent variable. If one varies systematically with the independent variable, it becomes confounding and threatens the conclusions.
Hypotheses
The null hypothesis predicts no difference or relationship. The alternative hypothesis predicts one: directional (one-tailed) or non-directional (two-tailed).
Experimental Design
How participants are allocated to conditions.
Independent Groups
Different participants in each condition. No order effects, but participant variables can differ between groups. Random allocation helps.
Repeated Measures
The same participants take part in every condition. Controls participant variables, but risks order effects such as practice and fatigue. Counterbalancing reduces these.
Matched Pairs
Participants are paired on key characteristics, then one of each pair goes into each condition. Fewer participant differences, but matching takes time.
Sampling
Choosing participants from the target population.
Random
Every member of the population has an equal chance of selection. Unbiased in principle, but hard to achieve.
Systematic and Stratified
Systematic: every nth person from a list. Stratified: subgroups sampled in proportion to their size in the population, so the sample is more representative.
Opportunity
Whoever is available, often students. Quick and easy, but likely to be unrepresentative.
Volunteer
People who choose to take part, for example by answering an advert. Easy, but volunteers may differ from everyone else.
Reliability, Validity and Ethics
Whether results are consistent, whether they measure what they claim to, and whether the research is ethical.
Reliability
Consistency. Test-retest reliability checks results over time; inter-rater reliability checks agreement between observers.
Internal Validity
Whether the independent variable really caused the change. Threatened by demand characteristics and investigator effects; improved by standardised procedures, randomisation and single or double-blind designs.
External Validity
Whether results generalise to other settings (ecological validity), people (population validity) and times.
Ethics
The BPS Code of Human Research Ethics: informed consent, avoiding unnecessary deception, protection from harm, confidentiality, the right to withdraw and debriefing.
Data and Statistics
Describing the data, then testing whether a result is significant.
Levels of Measurement
Nominal (categories), ordinal (ranked data) and interval or ratio (equal units on a scale).
Descriptive Statistics
Measures of central tendency (mean, median, mode) and of spread (range, standard deviation), plus graphs.
Significance
Psychology usually uses p < .05: a less than 5% probability of the result if the null hypothesis were true. A Type I error is a false positive; a Type II error is a false negative.
Choosing a Test
Ask: difference or correlation? Independent or related design? What level of data?
- Nominal: chi-square (independent), sign test (related)
- Ordinal: Mann-Whitney U (independent), Wilcoxon (related), Spearman's rho (correlation)
- Interval, normally distributed: independent t-test, related t-test, Pearson's r (correlation)
Beyond the Basics
University courses add ANOVA for more than two conditions, regression to predict one variable from others, and effect sizes and confidence intervals alongside p values.
How to revise with this mind map
- Learn to spot the design. For any study described in a question, name the method, the independent and dependent variables, the experimental design and the sampling method.
- Pair every term with its strength and weakness. Exam answers on research methods almost always need both.
- Practise choosing statistical tests with the three questions: difference or correlation, independent or related, and the level of data. Run through practice scenarios until it is automatic.
- Use real studies. Link each concept to a study you know, such as a lab experiment with low ecological validity, so your evaluation is specific rather than generic.
- Make it yours. Build your own research methods map in Mindmapi from your lecture notes, and ask the AI about any branch you are unsure of. The answer is saved into that branch's notes for next time.
Frequently asked questions
What is the difference between reliability and validity?
Reliability is consistency: whether a measure gives the same results when repeated or used by different researchers. Validity is accuracy: whether it measures what it claims to, and whether the results generalise beyond the study.
How do I choose a statistical test in psychology?
Ask three questions: are you looking for a difference or a correlation, is the design independent or related, and what level is the data (nominal, ordinal or interval)? The answers point to one test, for example Mann-Whitney U for a difference between independent groups with ordinal data.
What are the three experimental designs?
Independent groups (different people in each condition), repeated measures (the same people in every condition) and matched pairs (similar people paired, one in each condition).
What does p < .05 mean?
That there is less than a 5% probability of getting a result at least this extreme if the null hypothesis were true. Psychologists usually treat that as statistically significant.
What are the main ethical issues in psychology research?
Under the BPS Code of Human Research Ethics: informed consent, avoiding unnecessary deception, protection from harm, confidentiality, the right to withdraw and debriefing.
How do I make my own research methods mind map?
Put research methods in the centre and add branches for designs, variables and hypotheses, experimental design, sampling, reliability and validity, and statistics. To save time, paste your lecture notes into Mindmapi and it will build a first draft of the map for you to edit.
Turn your own notes into a mind map
Upload your class notes, a PDF or a lecture recording and Mindmapi builds the map for you. Your first map is free.
Try It Free


