Marketing Mind Map (A Level Business)
A level · Business · Checked against AQA and Edexcel · Updated 31 October 2026
This marketing mind map puts the whole topic on one page: market research, segmentation, targeting and positioning, the marketing mix, the product life cycle and Boston Matrix, pricing and price elasticity, promotion and place, and marketing strategy with the Ansoff Matrix. Every branch is explained in the notes below the map.
It covers AQA's marketing topic and Edexcel's Theme 1. Exam answers need application and evaluation, so the notes point out the limitations of each model.
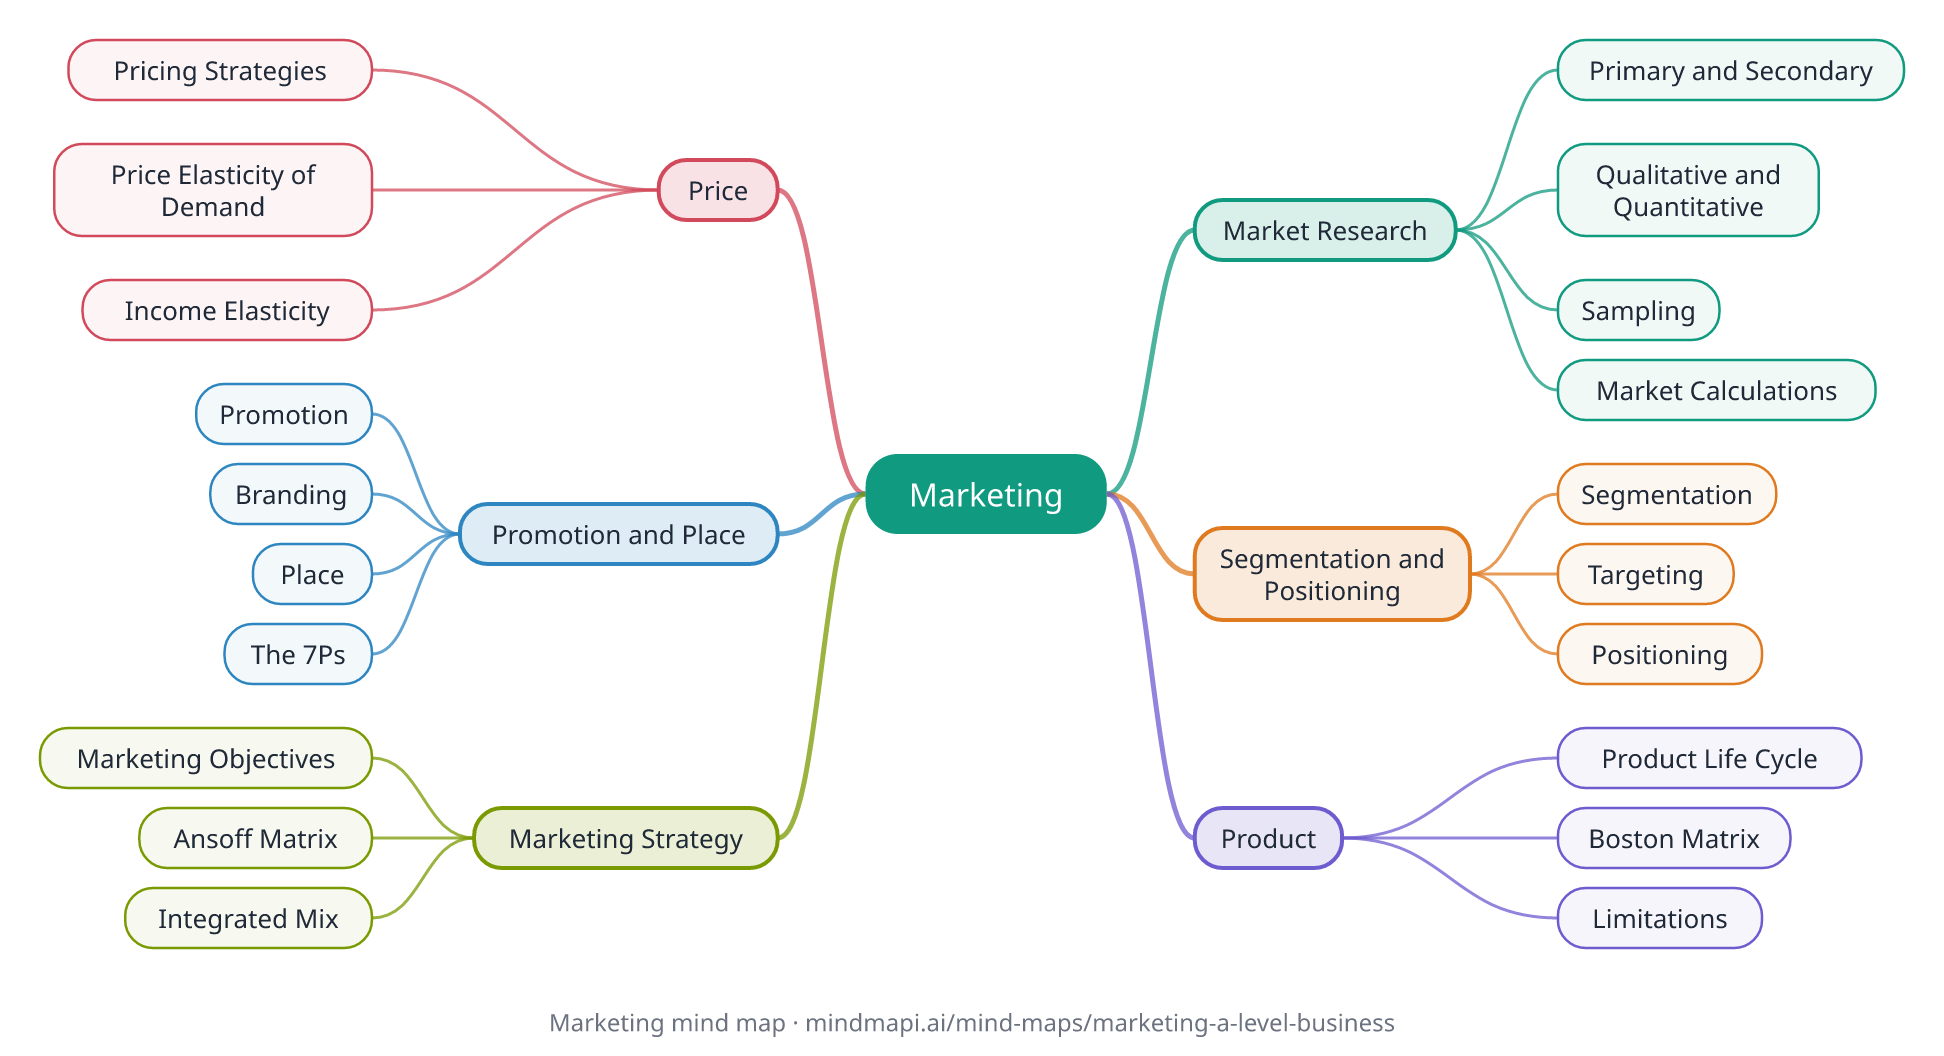
Download this mind map
Print the map with all the notes as a PDF revision sheet, or save the map as an image. Free to use for revision and in class.
Marketing mind map explained
Market Research
Finding out about customers, competitors and the market.
Primary and Secondary
Primary research is new data the business collects itself, such as surveys and focus groups: specific but costly. Secondary research uses existing data, such as government statistics: cheaper but may be out of date.
Qualitative and Quantitative
Qualitative data is about opinions and reasons; quantitative data is numerical and easier to analyse.
Sampling
Random, quota and stratified sampling. A bigger, more representative sample gives more reliable results but costs more.
Market Calculations
Market share = the firm's sales ÷ total market sales × 100. Market growth = change in market size ÷ original size × 100.
Segmentation and Positioning
Deciding who to sell to and how to be seen.
Segmentation
Dividing the market into groups by demographic, geographic, behavioural or psychographic factors.
Targeting
Choosing which segments to serve: a niche market (small, specialised) or a mass market.
Positioning
How customers see the product compared with rivals. A perceptual (positioning) map plots brands on two features, such as price and quality, revealing gaps in the market.
Product
Managing products over time and across a range.
Product Life Cycle
Development, introduction, growth, maturity and decline. Extension strategies, such as new features or new markets, can lengthen maturity.
Boston Matrix
Plots products by market growth and relative market share:
- Stars: high growth, high share
- Cash cows: low growth, high share
- Question marks: high growth, low share
- Dogs: low growth, low share
Limitations
Both models simplify reality: life cycles vary hugely in length, and the Boston Matrix ignores profit and links between products.
Price
Choosing a price and predicting how demand will respond.
Pricing Strategies
Cost-plus, penetration (low to win market share), price skimming (high at launch), competitive, psychological (for example £9.99) and price discrimination.
Price Elasticity of Demand
PED = % change in quantity demanded ÷ % change in price. Above 1 (ignoring the sign) is elastic: a price rise lowers revenue. Below 1 is inelastic: a price rise raises revenue.
Income Elasticity
YED = % change in quantity demanded ÷ % change in income. Positive for normal goods, negative for inferior goods.
Promotion and Place
Telling customers about the product and getting it to them.
Promotion
Advertising, sales promotions, public relations, sponsorship, and digital and social media marketing, which allow precise targeting.
Branding
A strong brand builds loyalty and lets a business charge higher prices.
Place
Distribution channels, from selling direct to using wholesalers and retailers. Multichannel distribution combines shops and online sales.
The 7Ps
For services, the marketing mix adds people, process and physical environment to product, price, promotion and place.
Marketing Strategy
Linking marketing decisions to the business's objectives.
Marketing Objectives
For example, increasing market share, sales volume or brand awareness. Good objectives are SMART.
Ansoff Matrix
Growth options by risk:
- Market penetration: existing products, existing markets (lowest risk)
- Product development: new products, existing markets
- Market development: existing products, new markets
- Diversification: new products, new markets (highest risk)
Integrated Mix
The 4Ps must fit together and match the target market: a premium product needs a premium price, place and promotion.
How to revise with this mind map
- Learn the models with their limitations. For the product life cycle, Boston Matrix and Ansoff Matrix, be ready to explain how a business would use each and why it might mislead.
- Practise the calculations: market share, market growth, and price and income elasticity, including what the answer means for revenue.
- Apply everything to the case study. Use the business's name, figures and situation in every point: generic answers score low.
- Build evaluation into every answer. Ask what it depends on, such as the market, the competitors or the business's finances, and reach a justified judgement.
- Make it yours. Build your own marketing map in Mindmapi from your notes, and ask the AI about any model you are unsure of. The answer is saved into that branch's notes for next time.
Frequently asked questions
What is the Boston Matrix?
A model that classifies a firm's products by market growth and relative market share into stars, cash cows, question marks and dogs, to help it manage a balanced product portfolio.
How do you calculate price elasticity of demand?
PED = % change in quantity demanded ÷ % change in price. If the answer, ignoring the minus sign, is above 1, demand is price elastic; below 1, it is price inelastic.
What is the Ansoff Matrix?
A model of growth strategies by risk: market penetration, product development, market development and diversification. Diversification, with new products in new markets, is the riskiest.
What is the difference between penetration pricing and price skimming?
Penetration pricing sets a low price at launch to win market share quickly. Price skimming sets a high price at launch, often for new technology, then lowers it over time.
What are the 7Ps of marketing?
Product, price, place and promotion, plus people, process and physical environment, which matter especially for services.
How do I make my own marketing mind map?
Put marketing in the centre and add branches for market research, segmentation, product, price, promotion and place, and strategy, with a real business example on each. To save time, paste your notes into Mindmapi and it will build a first draft of the map for you to edit.
Turn your own notes into a mind map
Upload your class notes, a PDF or a lecture recording and Mindmapi builds the map for you. Your first map is free.
Try It Free


