Business Finance Mind Map (A Level Business)
A level · Business · Checked against AQA and Edexcel · Updated 31 October 2026
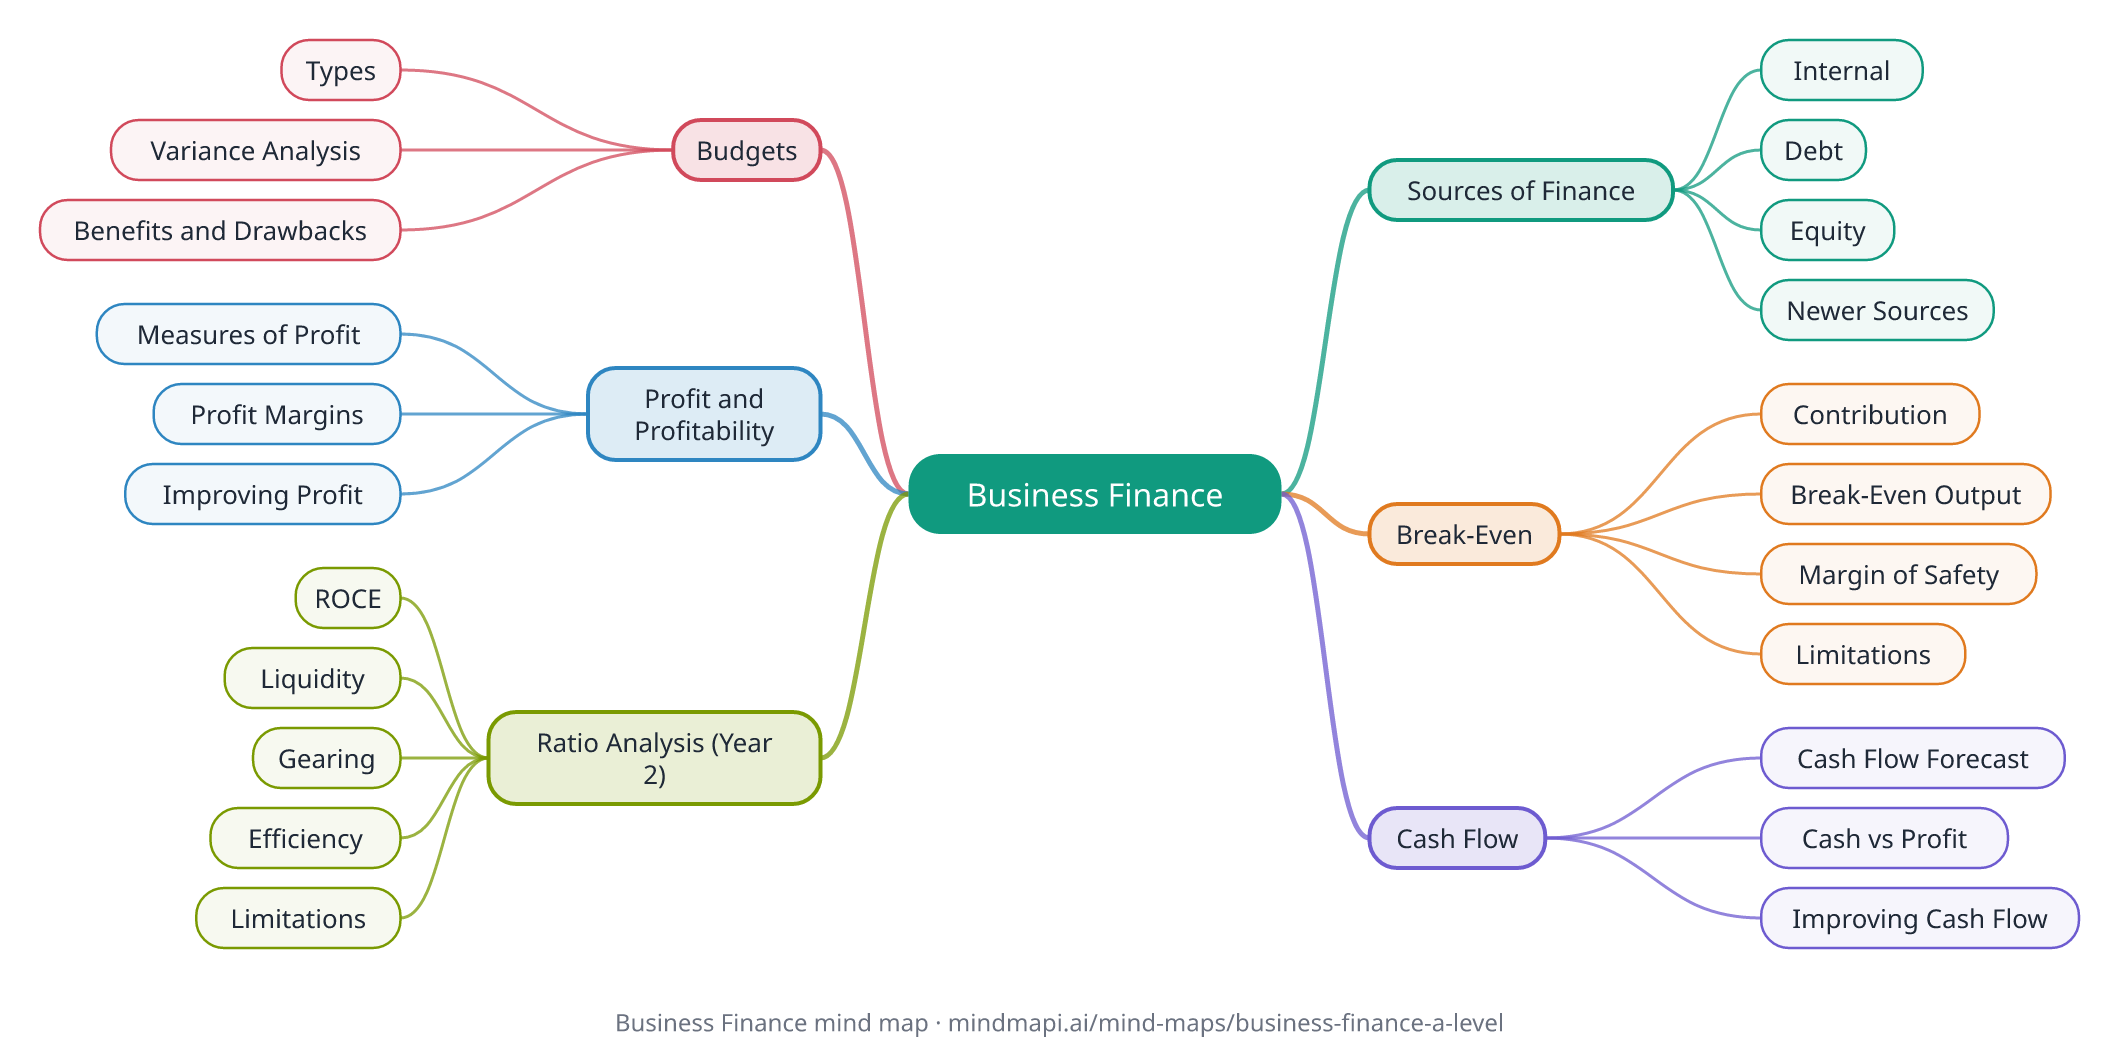
This business finance mind map puts the topic on one page: sources of finance, break-even analysis, cash flow forecasts, budgets and variances, profit and profitability, and ratio analysis. Every branch is explained in the notes below the map.
It covers AQA's finance topics and Edexcel's Themes 2 and 3. Finance questions combine calculations with judgement, so the notes give each formula and what the answer tells a business.
Download this mind map
Print the map with all the notes as a PDF revision sheet, or save the map as an image. Free to use for revision and in class.
Business Finance mind map explained
Sources of Finance
Where a business gets the money it needs.
Internal
Retained profit and selling assets. No interest to pay, but limited in amount.
Debt
Bank loans, overdrafts, trade credit and leasing. Keeps ownership, but must be repaid with interest.
Equity
Share capital, venture capital and business angels. No repayments, but owners give up some control and profit.
Newer Sources
Crowdfunding and peer-to-peer lending, often used by start-ups.
Break-Even
The output at which total revenue equals total costs: no profit, no loss.
Contribution
Contribution per unit = selling price − variable cost per unit. It goes towards paying fixed costs, then profit.
Break-Even Output
Break-even output = fixed costs ÷ contribution per unit.
Margin of Safety
Actual output − break-even output: how far sales can fall before the business makes a loss.
Limitations
Assumes all output is sold at one price and costs are linear, and is only as reliable as the forecasts behind it.
Cash Flow
The movement of cash into and out of a business. Running out of cash is a common cause of business failure.
Cash Flow Forecast
Predicts monthly cash inflows and outflows. Net cash flow = inflows − outflows; closing balance = opening balance + net cash flow.
Cash vs Profit
A profitable business can still run out of cash, for example if customers pay late or it buys a lot of inventory.
Improving Cash Flow
Chasing receivables, factoring, delaying payments to suppliers, overdrafts, and sale and leaseback.
Budgets
Financial plans for income and spending over a period.
Types
Income budgets, expenditure budgets and profit budgets. Budgets can be historical (based on last year) or zero-based (built from nothing).
Variance Analysis
Comparing actual results with the budget. A favourable variance improves profit; an adverse variance reduces it.
Benefits and Drawbacks
Budgets help control spending and set targets, but can be inflexible and demotivating if imposed from above.
Profit and Profitability
How much profit a business makes, and how well it turns revenue into profit.
Measures of Profit
- Gross profit = revenue − cost of sales
- Operating profit = gross profit − other operating expenses
- Profit for the year = operating profit + finance income − finance costs − tax
Profit Margins
Gross, operating and net profit margins = the profit ÷ revenue × 100. Margins allow comparison between businesses of different sizes.
Improving Profit
Raise prices, increase sales volume, or cut costs, each with possible drawbacks.
Ratio Analysis (Year 2)
Using ratios from the financial statements to judge performance.
ROCE
Return on capital employed = operating profit ÷ capital employed × 100. The higher, the better the return.
Liquidity
Current ratio = current assets ÷ current liabilities, with about 1.5 to 2 often seen as healthy. The acid test ratio leaves out inventories.
Gearing
Gearing = non-current liabilities ÷ (total equity + non-current liabilities) × 100. Above 50% is highly geared, which is riskier when interest rates rise.
Efficiency
Inventory turnover, payables days and receivables days show how efficiently the business manages its working capital.
Limitations
Ratios are based on past data, ignore qualitative factors, and need comparing with other years or competitors to mean anything.
How to revise with this mind map
- Learn every formula, then practise until the calculations are quick and accurate. Show your working to earn method marks even if the answer slips.
- Always interpret the number. After each calculation, say what it means for this business and what it should do.
- Know the difference between cash and profit, and be ready to explain why a profitable business can still fail.
- Evaluate the tools. Break-even, cash flow forecasts and ratios all rely on assumptions and past data: say how reliable they are in the case study's context.
- Make it yours. Build your own finance map in Mindmapi from your notes, and ask the AI to check a calculation or explain a ratio. The answer is saved into that branch's notes for next time.
Frequently asked questions
How do you calculate break-even output?
Break-even output = fixed costs ÷ contribution per unit, where contribution per unit is the selling price minus the variable cost per unit.
What is the difference between cash flow and profit?
Profit is revenue minus costs over a period. Cash flow is the actual money moving in and out. A business can be profitable but run out of cash if customers pay late or money is tied up in inventory.
What is the margin of safety?
The difference between actual output and break-even output. It shows how far sales could fall before the business starts making a loss.
How do you calculate ROCE?
Return on capital employed = operating profit ÷ capital employed × 100. It shows how well the business uses its long-term capital to generate profit.
What does gearing show?
How much of a business's long-term capital comes from debt. Gearing = non-current liabilities ÷ (total equity + non-current liabilities) × 100. Above 50% is high, making the business more exposed to rising interest rates.
How do I make my own business finance mind map?
Put business finance in the centre and add branches for sources of finance, break-even, cash flow, budgets, profit and ratios, with the formula on each. To save time, paste your notes into Mindmapi and it will build a first draft of the map for you to edit.
Turn your own notes into a mind map
Upload your class notes, a PDF or a lecture recording and Mindmapi builds the map for you. Your first map is free.
Try It Free


